
Delivery Performance Dashboard: The Honest Verdict for Enterprise Logistics in 2026


Beyond Reporting: Why Your 2026 Logistics Strategy Demands a Proactive Control Tower
Your Q4 carrier performance report arrives in January. It confirms what you already knew: your carriers missed their SLAs, delivery exceptions spiked, and costs spiraled. The report is a perfect autopsy of a disaster. In 2026, an autopsy is no longer good enough. You need a command center, not a morgue.
For most enterprise logistics teams, the reporting stack still works the way it did a decade ago. Carrier portals each speak their own dialect. Static BI extracts land on a Monday and describe a week that already happened. By the time a transit-time slip shows up in a dashboard, the late shipments have already reached the customer and the SLA-credit conversation is already lost.
A delivery performance dashboard built for 2026 inverts that sequence. Think of it as a logistics control tower: one normalized source of truth that fuses every carrier's data, surfaces real-time visibility into in-flight shipments, predicts which ones are about to breach, and triggers action while you can still change the outcome.

The premise underneath the control tower is simple: carriers measurably differ on the one metric you are judged on. In ShipMatrix data reported by FreightWaves for the December 2025 peak, on-time delivery ranged from 94.1% at USPS to 95.3% at FedEx Express to 97.2% at UPS. Three points of spread across your highest-volume lanes is the difference between a clean peak and a war room.
That spread is also why carrier mix is a board-level decision, not a procurement footnote. The same logic extends to choosing the right 3PL: you cannot hold a partner accountable to numbers you cannot see in time to act on them. A control tower exists to close the gap between what already happened and what you can still influence.
The 5 Non-Negotiable Capabilities of an Enterprise-Grade Delivery Performance Dashboard
Before you shortlist a single vendor, fix your evaluation criteria. Five capabilities separate a genuine command center from a prettier rearview mirror. Treat each as a question to put to every platform you assess, including any in-house build or category roundup such as the standard multi-carrier parcel management solutions comparisons.
- Carrier-agnostic truth. Can it normalize data from every carrier you use, not just the national majors? The bar to clear is a tracking-data network in the range of 1,300+ carriers, reconciled into one schema, so that a "delivered" status means the same thing across UPS, a regional LTL partner, and a cross-border last-mile courier.
- Granular performance analytics. Does it move past a single network average? True delivery dashboards analyze performance by specific shipping lanes, by service level, and by origin warehouse, because a 97% network average can still hide a double-digit failure rate on the one lane carrying your highest-margin orders.
- Proactive exception management. Does it flag shipments at risk before they are late? AI-powered analytics proactively identify at-risk shipments before they are late, which is the entire reason to trade a weekly report for a live feed.
- Actionable insights layer. Does it surface the outliers and point you to the fix, instead of leaving you to assemble a carrier scorecard by hand? The scorecard here is a capability you compose from several views, not a single button to press.
- Data accessibility and integration. Can you pipe the raw, cleaned data into your own BI or ERP through an API, webhooks, or CSV export? If the numbers are trapped inside a vendor's UI, they cannot drive your QBRs or your carrier negotiations.
Score every option against all five. A delivery performance dashboard that satisfies only one or two is a report with better styling. The one that satisfies all five is what separates reacting to last quarter from steering the next one.
Deep Dive: How AfterShip Intelligence Delivers on These 5 Capabilities
Criteria are easy to list and hard to satisfy. Here is how AfterShip Intelligence answers each of the five, with the real dashboard names and the honest plan boundaries, so you can match capability to the line item your procurement team will actually sign.
1. Carrier-agnostic truth. AfterShip Intelligence normalizes performance data across 1,323 carriers, collapsing every status code and timestamp into one schema. The value is not the raw count. It is that a "delivered" event from a regional courier in Spain is directly comparable to one from UPS in Ohio, on the same definitions, in the same report.
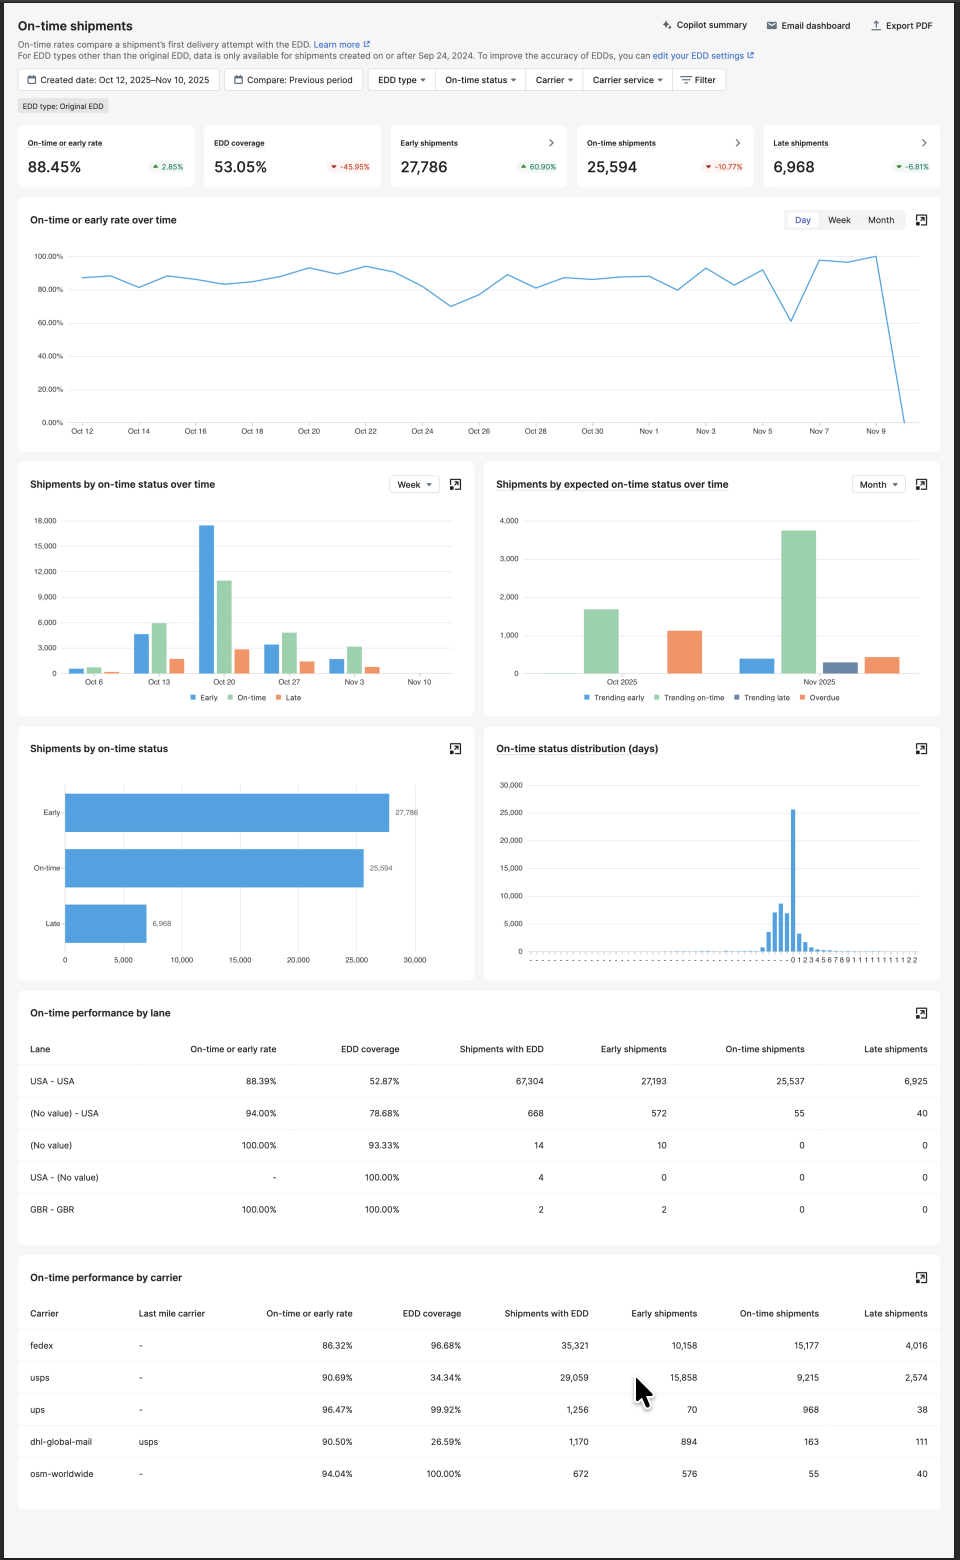
2. Granular performance analytics. This is where averages go to die. On-Time Shipment Analytics breaks results down by "Performance by lane" and "Performance by carrier," so you see exactly which origin-to-destination pairs and which carriers are dragging your OTD.
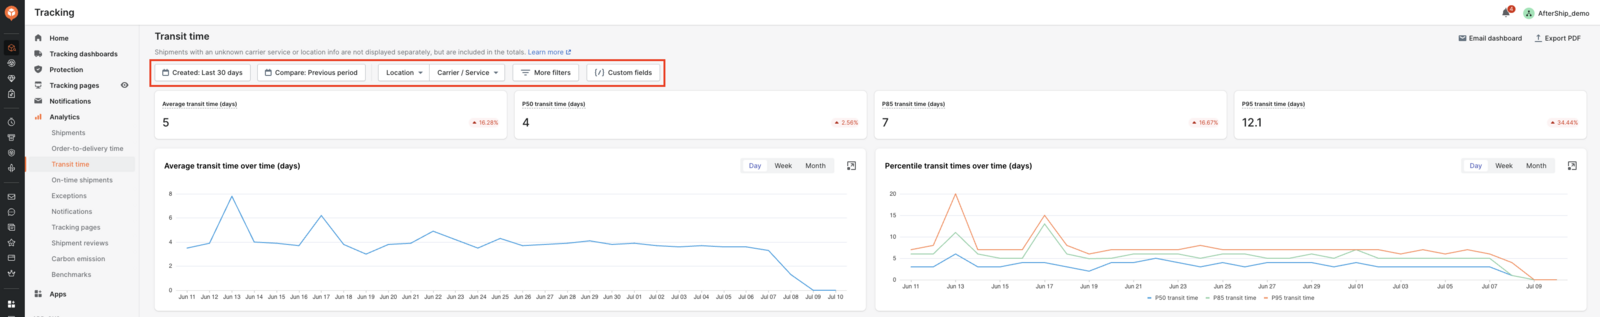
The Transit Time Report adds P50, P85, and P95 transit percentiles by lane, which is the gap between "our average is fine" and "our 95th percentile runs three days late on the West Coast." Both reports sit on the Premium and Enterprise Advanced plans, and the order-to-delivery time analytics dashboard extends the same lens from carrier handoff back to the moment the order was placed.
3. Proactive exception management. Shipment Alerts is the live feed that replaces the weekly autopsy. It watches for stuck-shipment risk, shipments missing a first scan, on-time delivery drops, lane-level anomalies, clustered exception anomalies, delivery-delay spikes, and carrier-performance anomalies, several of them AI-driven. There is no public "we warn you X hours early" number, and you should distrust any vendor that quotes one. The honest claim is directional: you learn about an at-risk cohort while you can still reroute, escalate, or notify, rather than after the customer already has. Alerts are an Enterprise Standard and Advanced capability.
4. Actionable insights layer (the carrier scorecard). A carrier scorecard is not a button you press. It is a view you assemble. AfterShip Intelligence builds it from the Carrier Performance Comparison report inside Shipment Events Analytics, the "Performance by carrier" cut of On-Time Shipment Analytics, and the carrier-performance anomaly alert. Together they answer the question your COO actually asks: which carrier, on which lane, is costing us money this quarter? Carrier Performance Comparison sits on Enterprise Advanced only, so scope it into your plan deliberately.
5. Data accessibility and integration. None of this matters if the data is trapped. AfterShip exposes a REST API (with SDKs and OAuth 2.0), webhooks, and CSV export, so you can pull raw, cleaned shipment data into your own warehouse and join it to cost and revenue tables. One honest limitation: there is no certified native warehouse or ERP connector, and exact refresh cadence and retention are set in your enterprise agreement. For 3PLs running many clients, the model is multi-organization management at the enterprise tier, not a white-label client portal product.
The Honest Verdict for 2026: AfterShip Intelligence vs. Narvar vs. Building In-House
Start with what the alternatives do well, because a verdict you can trust names the trade-offs. Narvar is a capable, customer-experience-led platform with genuine real-time, multi-carrier delivery visibility and disruption tracking; some brands run on it for years for exactly that reason. The honest differentiator is depth. AfterShip Intelligence reports performance at the per-lane and per-carrier level and exposes transit-time percentiles, the granular cuts an operations analyst needs to hold a specific carrier accountable on a specific lane. On the industry-benchmark feature specifically, treat the two as comparable; that is not where the decision is won.
The friction enterprise reviewers report with Narvar is operational, not imaginary. On G2, one reviewer (Shyam T.) notes that heavy six-month reports can run "a little slow," and another (Wesley U.) finds the interface "too simplistic," with limited room to fine-tune. For a team that lives in the analytics every day, that is the difference between a tool and a chore.
| Criteria | AfterShip Intelligence | Narvar | In-House BI Solution |
|---|---|---|---|
| Data Normalization & Carrier Coverage | Normalizes data from a 1,300+ carrier tracking network into one schema, so every carrier reports on the same definitions | Real-time, multi-carrier delivery visibility across its public 1,000+ carrier network | You build and maintain every carrier integration yourself; coverage is capped at what you wire up and keep current |
| Analytics Granularity (lane, service, SKU) | Per-lane and per-carrier reporting with transit-time percentiles (P50/P85/P95) | Real-time carrier-performance and disruption tracking, with less lane-level and transit-percentile depth; industry benchmarks are comparable to AfterShip | Any granularity is possible, but every cut is custom-built and maintained |
| Predictive / AI Capabilities | AI-driven shipment alerts: stuck-shipment risk, missing first scan, on-time delivery drop, lane and clustered anomalies, delay spikes, carrier-performance anomaly | Real-time disruption detection and delivery visibility | You build, host, and retrain prediction models yourself against your own data scale |
| Data Export & API Access | REST API (SDKs, OAuth 2.0), webhooks, and CSV export into your warehouse; no certified native ERP connector | Available; export depth varies by package | Full control of the raw data, since the warehouse and pipelines are yours to own |
| Time to Value & TCO | Enterprise (Advanced) plan, custom-priced; analytics gated to Premium and Enterprise Advanced; fast to stand up on your existing network | Enterprise platform, quote-based | Highest TCO: the trap is ongoing maintenance of 1,300+ integrations and model retraining, not the one-time build |
Building in-house is the option that looks cheapest on the whiteboard and bills you forever. A massive enterprise with a dedicated data-engineering team and one or two carriers can make it work. The trap is not the one-time build. It is maintaining 1,300+ carrier integrations as carriers change their data formats, and retraining prediction models against a comparable data scale, every quarter, with no end date. And this is not a greenfield problem: real-time transportation visibility is an established, vendor-invested software category that Gartner tracks in a dedicated Magic Quadrant, so matching it in-house is a standing engineering commitment, not a weekend project, even though AfterShip is not in that freight-oriented quadrant, which centers on carrier and fleet visibility rather than post-purchase delivery analytics.
So the verdict is specific, not sweeping. If you run a deep, multi-carrier operation and need granular, proactive analytics, AfterShip Intelligence is the strongest fit, available as the Enterprise (Advanced) plan and custom-priced for volumes at your scale. If a single national carrier covers you and front-end experience matters more than operational depth, Narvar may be enough. Build in-house only when analytics is your core competency and your carrier list is short.
Building the Business Case: How to Calculate the ROI of a Delivery Performance Dashboard
Your CFO will not approve a dashboard. They will approve a number. The job here is to help you build that number from inputs you already own, not from a borrowed industry percentage that falls apart under scrutiny.
Start with a proof point that a normalized data layer pays for itself at scale. When eBay consolidated its carrier data on AfterShip, it lifted its Valid Tracking Rate by 20% and improved estimated-delivery-date accuracy by 10% in 2024, while growing from under 100 integrated carriers to more than 650 (roughly 400 active weekly). The operational result: over 200,000 packages auto-corrected every month and more than $1M in operational savings.
eBay auto-corrected 200,000+ packages per month and saved $1M+ by normalizing carrier data with AfterShip. (Source: eBay customer story)
Those are eBay's numbers, not yours, which is exactly the point. Use them as evidence that the mechanism works, then model your own case. The carrier on-time spread established earlier in this article is the lever: a few points of OTD difference between carriers, applied across your volume, is real money.
The framework is one line: cost-per-shipment x volume x OTD delta. Take your fully-loaded cost of a late shipment (re-ship, support contact, credit, churn risk), multiply by monthly volume, then by the percentage-point OTD improvement a better carrier mix or an earlier intervention can capture. A worked illustration: at $8 per failed delivery, 50,000 monthly shipments, and a 2-point OTD recovery, that is 1,000 shipments at $8, or $8,000 a month, before you count the SLA credits you can now actually claim. Plug in your real figures and the business case writes itself.
For the strategic framing, McKinsey estimates that roughly 10 to 20 percent of sales in omnichannel retail is consumed by fulfillment costs. A delivery performance dashboard does not erase that line. It is the instrument that tells you which carriers and lanes are inflating it.
Your Logistics Command Center Awaits
The question for 2026 is not whether you need a delivery performance dashboard. Peak season already answered that. The question is whether you want a reactive rearview mirror that explains last quarter, or a proactive control tower that lets you change the outcome of this one.
A rearview mirror is cheap and comfortable, and it will keep arriving in January with the same bad news. A control tower normalizes every carrier into one truth, shows you performance at the lane and carrier level, and warns you while there is still time to act. For an enterprise logistics team measured on cost and on-time delivery, AfterShip Intelligence is the clear choice.
Frequently Asked Questions
A few questions that come up most often when enterprise teams evaluate a delivery performance dashboard.
What are the most important KPIs for a delivery performance dashboard?
The core set is on-time delivery (OTD) rate, transit time and its variance (track the P85 and P95 percentiles, not just the average), exception and failure rates by carrier and by lane, first-scan and delivery-scan timeliness, and cost per shipment including failure-related costs. Measured by lane and by carrier, these KPIs tell you where to intervene, not just how you did last quarter.
How does a delivery performance dashboard help with carrier contract negotiation?
It replaces anecdotes with evidence. With reports such as Shipment Events Analytics and the Carrier Performance Comparison, you can show a carrier exactly where and how often they missed agreed service levels, then negotiate better rates or service level agreements based on actual performance rather than the carrier's own summary.
Can AfterShip Intelligence integrate with an ERP like SAP or Oracle?
Yes, via AfterShip's REST API and webhooks. Teams typically connect SAP, Oracle, or NetSuite through that API and webhook layer, usually with help from their iPaaS or integration team. AfterShip does not publish a certified native ERP connector, so confirm specific connector availability with the enterprise team before you scope the project.