
3 Steps to Start Using Data to Grow Sales

For online businesses, the ability to measure every single customer interaction has opened up unparalleled opportunities for using data to make better decisions. But even though data are increasingly available to support decision making, the abundance of it has ironically increased the prevalence of gut-based decisions over data-based decisions.
This is a guest post from the team at Compass. [Compass](http://report.compass.co/free-signup/?utm_source=partner&utm_medium=partner&utm_campaign=aftershipblog" target="_blank) empowers small and medium-sized stores with enterprise-level analytics and reporting without the need for an army of analysts.
In behavioural sciences, the phenomenon of bad decision-making due to an overwhelming amount of information available is often referred to as “information blindness.”
According to Charles Duhigg, in his book [Smarter Faster Better](https://www.amazon.com/Smarter-Faster-Better-Productive-Business-ebook/dp/B00Z3FRYB0/" target="_blank), information blindness occurs when the brain reaches a point where the information it has to process becomes too much to handle. When that happens, people start ignoring options, making bad choices and even stop dealing with the information altogether.
In the same way that consumers have trouble going through a massive list of wines at a restaurant, companies can also become blind to information and start making bad decisions.
Most businesses do not know what they should be measuring, how they should measure it, and how to interpret metrics to make the decision to take one action over another.
A primary cause of this lack of fluency is the fact that most entrepreneurs and marketers don’t have access to an adequate framework (i.e., context) from which they can base their decisions. Without proper context, data is rarely useful in providing new knowledge and, most importantly, new ideas.
The three most common challenges companies face when attempting to find game-changing insights from their data are:
- They don’t know what to measure to track the progress on their primary objective
- They don’t know how to interpret the data they have measured
- They don’t understand their own development cycle
Based on these challenges, [Compass](http://report.compass.co/free-signup/?utm_source=partner&utm_medium=partner&utm_campaign=aftershipblog" target="_blank) developed a simple 3-step framework to help companies avoid information blindness and use data objectively to increase sales:
Step 1: Know What to Measure
Knowing what to measure give entrepreneurs and marketers clarity on what they should be focusing on and prevent them from basing business decisions on pure instinct or on metrics that aren’t relevant for their businesses.
To overcome this difficulty, comparing your performance with companies in the same industry and of similar sizes is very useful.
Social networking sites, for example, will probably need to place a special consideration on metrics such as Number of Signups, Page Views, Time on Site or Returning Visitors. These are very different from what an ecommerce business should focus on. For online stores, Conversion Rate, Bounce Rate, and average cart value will likely have a more significant impact on their success.
Another critical thing is to understand exactly in which stage of the development cycle (more about this below) you are. This knowledge will give you clues on the metrics you need to focus on to move on to the next stages.
Step 2: Know How To Interpret Data
The main difficulty that arises, once businesses have learned what their key metrics are, is not knowing how to interpret these metrics to make decisions that improve their business.
Understanding the specific performance indicators that are most relevant is crucial because a prosperous growth strategy is one that focuses almost exclusively on the biggest obstacles to growth. The best performing companies channel their most precious resources (human capital) towards these important issues.
Intelligent benchmarking allows companies to uncover valuable information and accordingly, adapt their behavior. For instance, let’s say you found out that your page view numbers are performing badly compared to the best companies in the industry. Now you can use this knowledge to drive your strategic decisions towards that particular goal.
Step 3: Understand your company’s lifecycle
According to our model, the Startup Lifecycle is made of 4 stages of development: Discovery, Validation, Efficiency & Scale. Each of those stages requires you to apply a different type of mindset and analyze various types of data.
We have plenty of qualitative and quantitative analysis showing that companies who move through these stages in sequence perform massively better than companies who don’t.
So let’s go through a basic description of each stage and the metrics you should be watching for to correctly assess if you’re mature enough to move to the next stage or not:
Discovery
In this stage, you are searching for Problem / Solution Fit. More specifically, this means you’re trying to investigate whether your hypothesized product is solving a problem that your target market have a strong need/desire to have answered.
Many startups either don’t do this stage properly or skip straight to validation. They end up spending a lot of technical effort designing and coding a product that, as it turns out, nobody is interested in using.
Understanding this stage requires more qualitative than quantitative data analysis. Nothing trumps talking to your customers about their experiences and needs when you are in discovery stage.
Validation
In this stage, you are searching for Product / Market Fit. More specifically, this means you’re looking to build minimum viable products (MVPs) in increasing levels of resolution and completeness.
To successfully advance from the validation stage, you’re searching to create a repeatable ‘must-have’ experience for a significant customer segment. This segment needs to be substantial so that you can scale your company around it.
Many companies move on to the efficiency and scale stages before they’ve reached Product / Market Fit. They waste a lot of time and money optimizing and marketing a product that users don't think are very compelling.
The performance indicators in the validation stage will evaluate the importance of your product in the lives of your target market and corresponding key customer segments:
-
Returning visitor: This is the percentage of users who return to your site or application after their first visit.
-
Time on site: This is the average amount of time users spend on your site or application per session.
-
Pages per visit: This is the average number of pages on a user views on your site per session. The precise pathway of what pages they visited, in what particular order may also be provided.
-
Bounce rate: This is the percentage of users who visit a single page on your website or application and then leave before taking additional actions.
At Compass you measure these metrics and compare them with companies similar to you (and to your past performance) so you can have them in the right context (see image below).
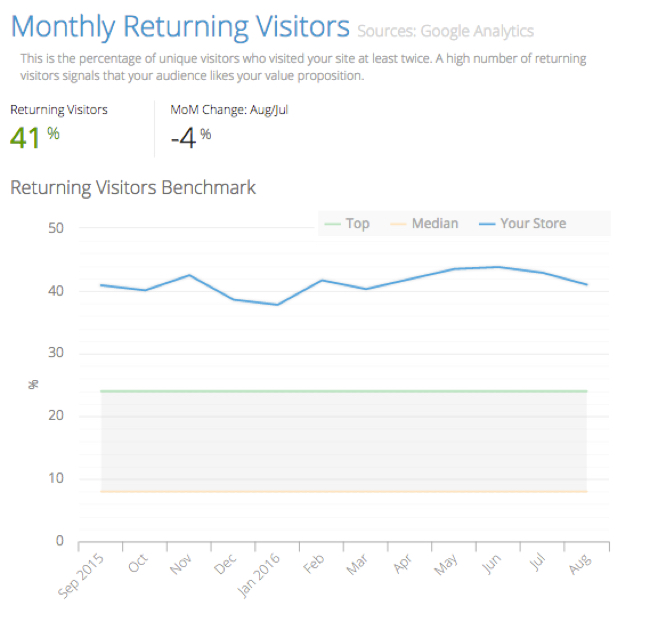
Compass Returning Visitors Report ([click know more](http://report.compass.co/free-signup/?utm_source=partner&utm_medium=partner&utm_campaign=aftershipblog" target="_blank))
Efficiency
In this stage, your startup has found Product / Market Fit. You are now preparing your company to be able to handle massive growth in the proceeding scale stage.
This stage is where you refine your business model, optimize your landing pages and conversion funnels. It’s also when you solidify your technical infrastructure as well identify the values of your company culture.
Businesses that skip this stage and scale too quickly after Product / Market Fit are metaphorically similar to an unprepared rocket launch. Businesses inevitably blow up and disintegrate rather than reach the stratosphere.
In this stage you will be improving the satisfaction of the users with your product. Some of the most important metrics are:
-
LTV: [Lifetime value](http://blog.compass.co/how-to-build-a-profitable-business-demystifying-customer-lifetime-value-with-exclusive-data-from-compass/?utm_source=partner&utm_medium=partner&utm_campaign=aftershipblog" target="_blank) is the mathematically calculated monetary value the average user will spend on your company’s products and services during the entire timeframe they remain a customer of your company. The key variables of the LTV equation are the average time length an individual remains a customer of your company, retention rate and profit margin per customer.
-
Page Load Time: Increasing speed has become a fundamental product requirement. People need things faster and more readily. Every second count when it comes to the time it takes for a page to load, and that has a direct effect on business results.
-
CAC: Cost per acquisition is the most important metric to measure and monitor if you’re doing paid advertising. Benchmarking your CAC against companies similar to yours will help understand how effective your marketing is and how much room for improvement you may still have.
-
[Conversion Rate](http://blog.compass.co/the-roi-of-conversion-rate-optimization-for-e-commerce-companies/?utm_source=partner&utm_medium=partner&utm_campaign=aftershipblog" target="_blank): The percentage of people that came through a particular marketing channel and signed up or made a purchase.
Calculating LTV, CAC and other metrics can be challenging, since you need to take into account technical issues, returns and different currencies. Compass does it all for you automatically (see below).
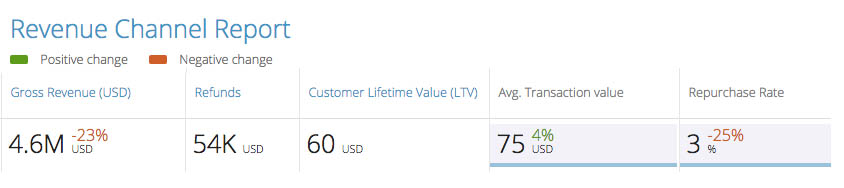
Compass Revenue Report ([click to know more](http://report.compass.co/free-signup/?utm_source=partner&utm_medium=partner&utm_campaign=aftershipblog" target="_blank))
Scale
In this stage, companies are ready to step on the gas pedal and drive growth very aggressively.
Once you have validated your unit economics, identified a variety of profitable customer acquisition channels, and know that your product can technically handle the increased usage, you are ready to start aggressively pumping financial and human resources to profitably saturate these growth channels.
If you’re in the scale stage, it’s time watch out for the top-line metrics of your business:
-
Revenue: Make sure that your monthly revenue numbers are pointing up.
-
Avg. Transaction Value: Selling more of higher priced products will help you improve your overall business performance.
-
Transactions: Make sure growth is steady by improving the number of transactions weekly or even daily.
-
Unique visitors: If all your other metrics are trending up, then watch for your unique number of visitors as well. Just be careful not to pay too much attention to this metric before you optimize other core areas of your product.
With Compass you’ll be able to understand how each of your acquisition channels perform. Knowing what impacts your business’ bottom line will help you use to data to better make decisions about where to spend your marketing budgets (see graph below).
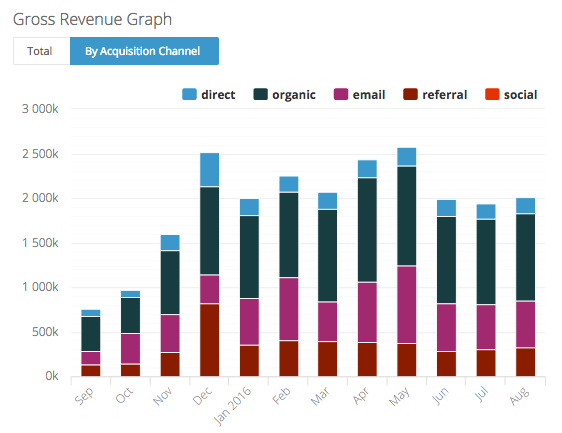
Compass Executive report ([click to know more](http://report.compass.co/free-signup/?utm_source=partner&utm_medium=partner&utm_campaign=aftershipblog" target="_blank))
Conclusion
You absolutely need a framework to organize your data in the right context. Without understanding your own development stage, the metrics you should be looking out for and how your data stack up against others, you are really navigating blind. Good decision-making relies as much on having access to data as it does on understanding data properly.
[Compass](http://report.compass.co/free-signup/?utm_source=partner&utm_medium=partner&utm_campaign=aftershipblog" target="_blank) has been hard at work for many years to build the conceptual model, analytical framework and API infrastructure needed to enable this kind of peer-based context for better decision making.
We help entrepreneurs and marketers overcome difficulties they have with data analysis by comparing their performance with companies in the same industry and of similar sizes. Our system is organized in such a way that it provides a framework of standard metrics you can use to start measuring progress and success in a reliable way.